Custom Report Builder
Reporting Re-think
Intuit QuickBooks
FinTech
Intuit QuickBooks is a cloud based platform for small to medium sized businesses looking to manage their finances and optimize their accounting workflow.
The reporting tool is key to accountant workflows, and is at the heart of decision making and troubleshooting for businesses. We looked to create the second iteration of this advanced reporting tool to bring deep value to our users.
Role and responsibilities
Primary Product Design
My role as a Product Designer on this project included the following responsibilities:
- Conduct user and competitive research.
- Develop jobs to be done framework and customer problem statement to guide design decisions.
- Create wireframes, prototypes, and high-fidelity designs.
- Conduct usability testing.
- Balance scope changes and business needs with customer value
- Measure and analyze user engagement and usability metrics post-launch
Collaboration
I worked closely with our Project Manager and cross functional teams to manage requirements and ensure a smooth implementation, as well as with secondary stakeholders to ensure key business requirements were met.
Problem Space
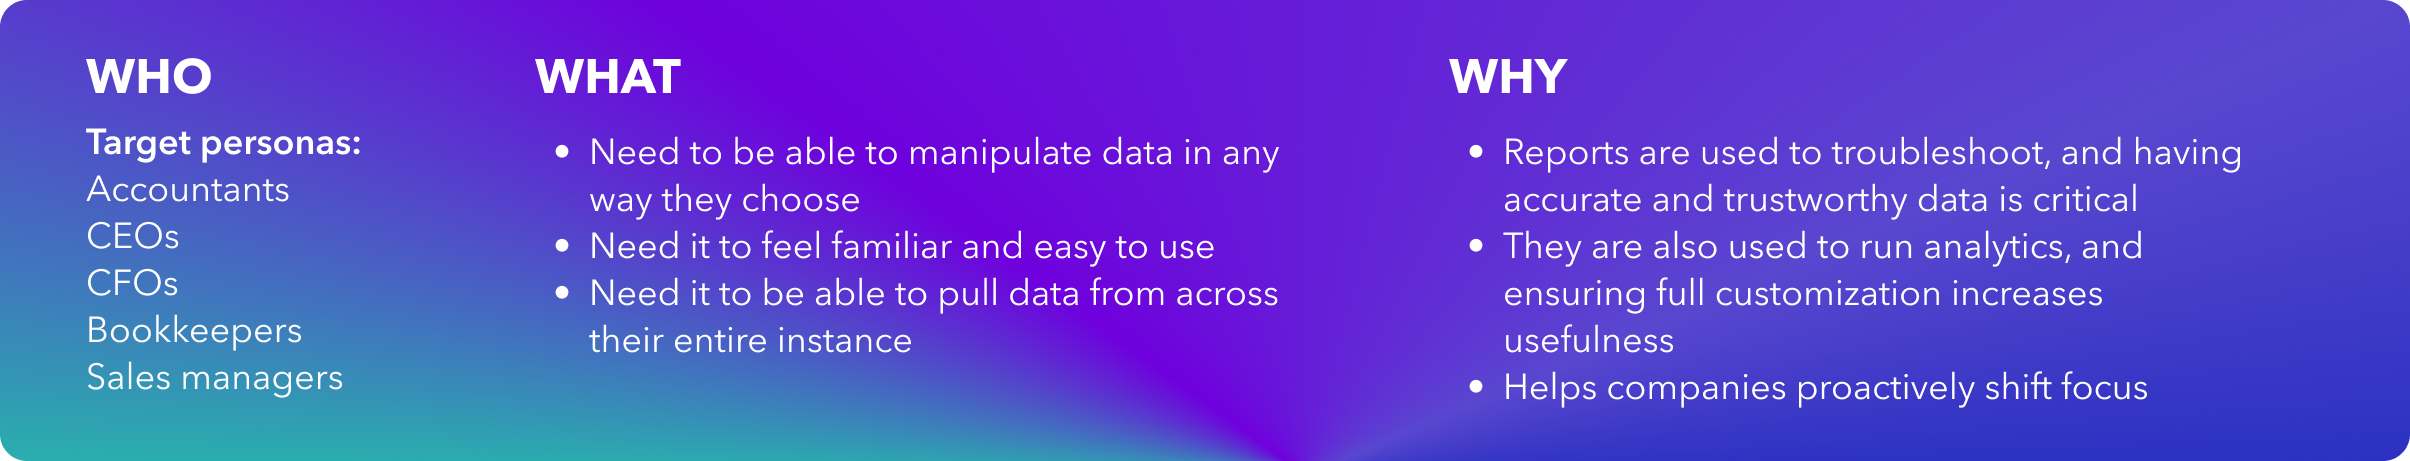
After receiving extensive feedback from our accounting customers about the limited customization for reports and difficulty troubleshooting financial errors due to this lack of functionality, our PM and I were excited to address this critical issue.
Our objective was to ensure accountants could trust and format their data flexibly, allowing them to focus on more critical financial tasks.
Solving the problem
Intro
As the solo Product Designer on this project, I took lead on completing the research and design of this product. The outcome was so complex we needed to break it out into sprints covering almost 12 months, and we slowly added new features after our initial release.
Research
Knowing that we had many outstanding questions, I conducted initial research via zoom interviews with 12 users from companies with differing levels of complexity.
We took initial findings and mapped common themes, and then associated them to some key conclusions which would inform our design:
The ultimate lens we landed on with our accountants was “Start with everything, let me filter out what I want” – we were previously filtering for them which broke their trust that we were providing them with all their data.
Design
Ideation
After presenting our working group with the research summary, I ran a brainstorming session to see what we could come up with for a set of features which would solve our users’ challenges. I used affinity mapping to gather common themes, and we used a voting system to quickly stack rank our priorities as a group.
Wireframing and User Testing
Initial wireframes were completed in Figma using pen sketches and lo-fi components. These were presented to our team before being shown to customers to ensure technical challenges were minimized before presenting possible solutions. I then had 10 users each explore the designs in a 1:1 video call.
I reviewed with PM/PD partners to ensure we all aligned on customer pain points of the new designs and then I created hi-fidelity designs for a second round of moderated and unmoderated user testing.
Outcome
Implementation
The complex nature of the feature and the fact that there were many smaller features building up the primary function meant a long duration, phased approach to implementation. The product was very positively received by our users, and set the groundwork for the next generation of reporting to come after it.
Upon the global release (1.5M+ QuickBooks Advanced customers) we continued to monitor our feedback channels and target metrics to ensure we had fully met our customer needs.
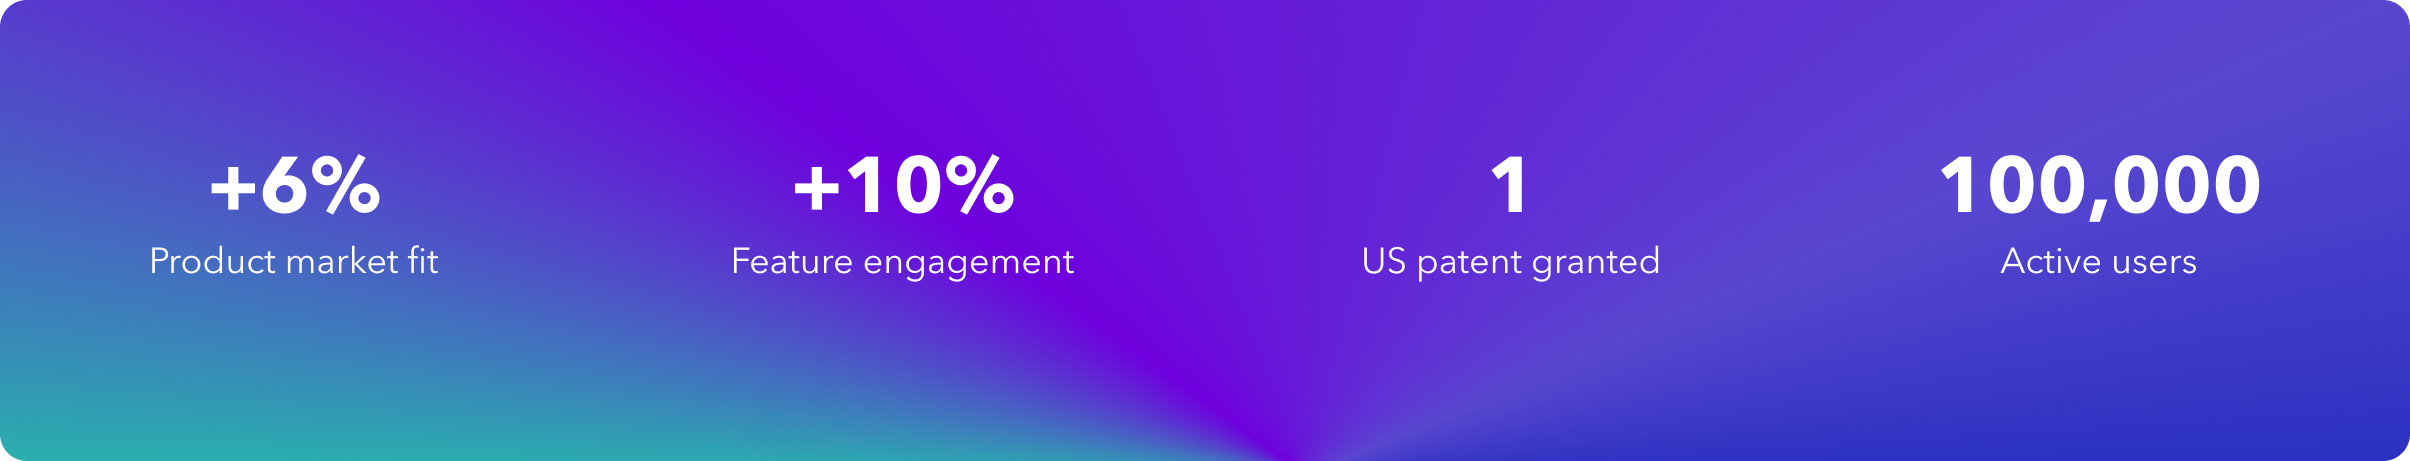
Results
Learnings
- Accountants really, really don’t like when you mess with their reports.
- Accountants can never fully trust the data, so instead of trying to make the data trustworthy we made it easy to gather all related data and then filter it.
- Engineering constraints were discussed early, and this reaffirmed the need for early collaboration as we avoided several pitfalls of data architecture that we may have encountered
- Touching database structure is a very lengthy process. I had initially predicted a 3-6 month timeline, and it was well over 9 months by the time we went full launch.
- Functionality is key, but a clean design helps users navigate a technically challenging feature
Tools and Tech
- Figma / Figjam
- UserTesting.com
- Zoom
- Comms tools (Slack, Outlook, Calendly)
Successful US Patent Filed

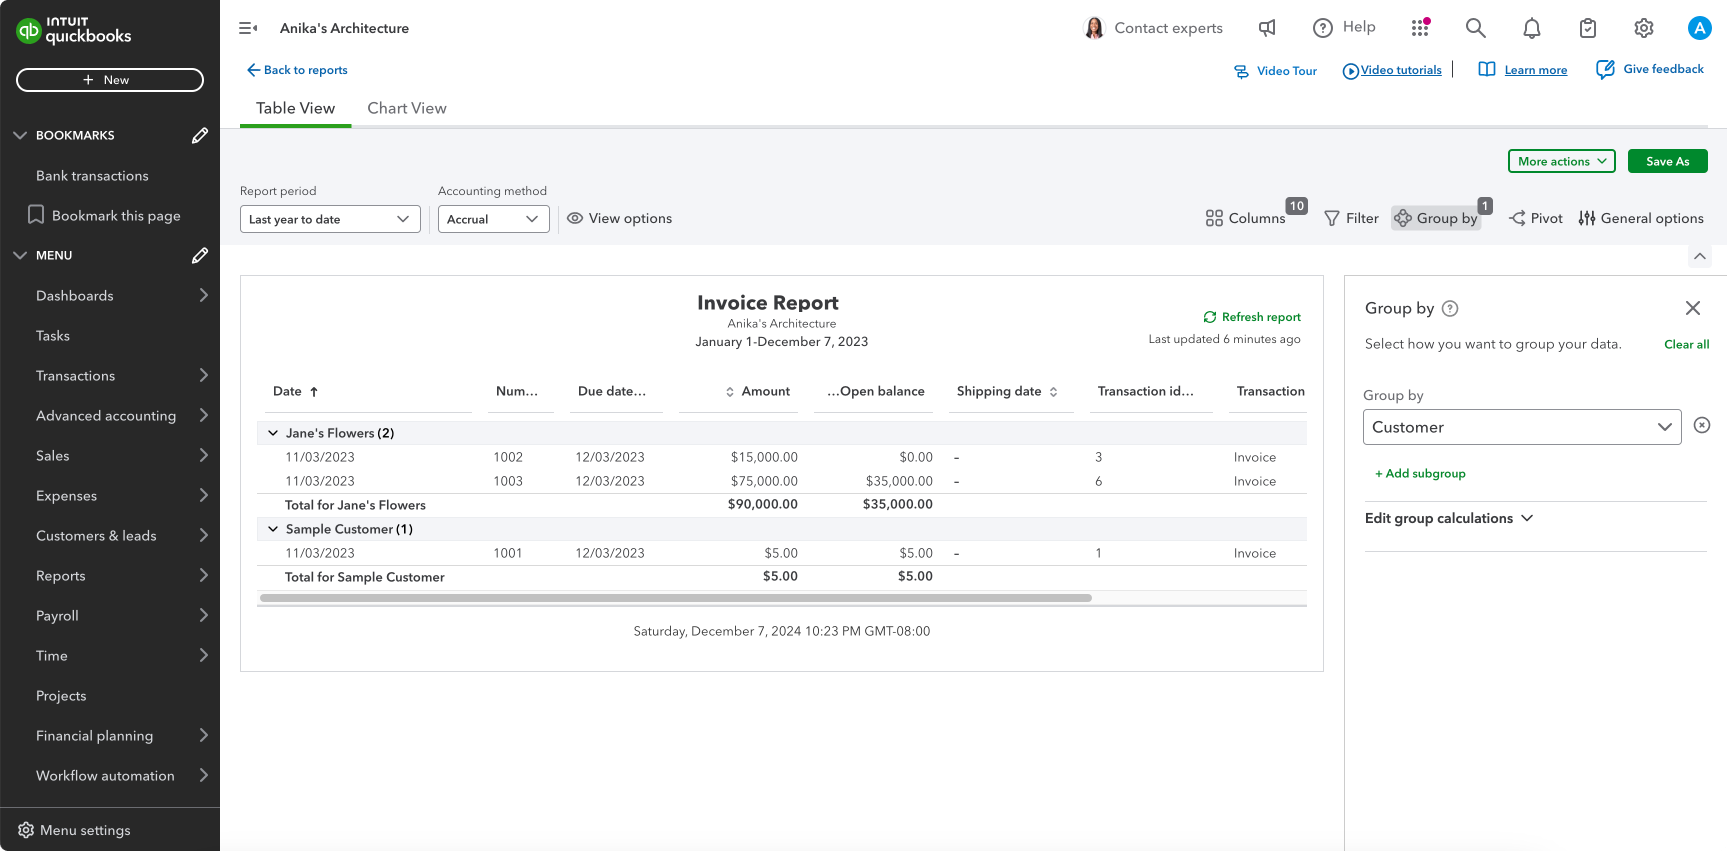
Final Custom Report Builder (Live, in product)